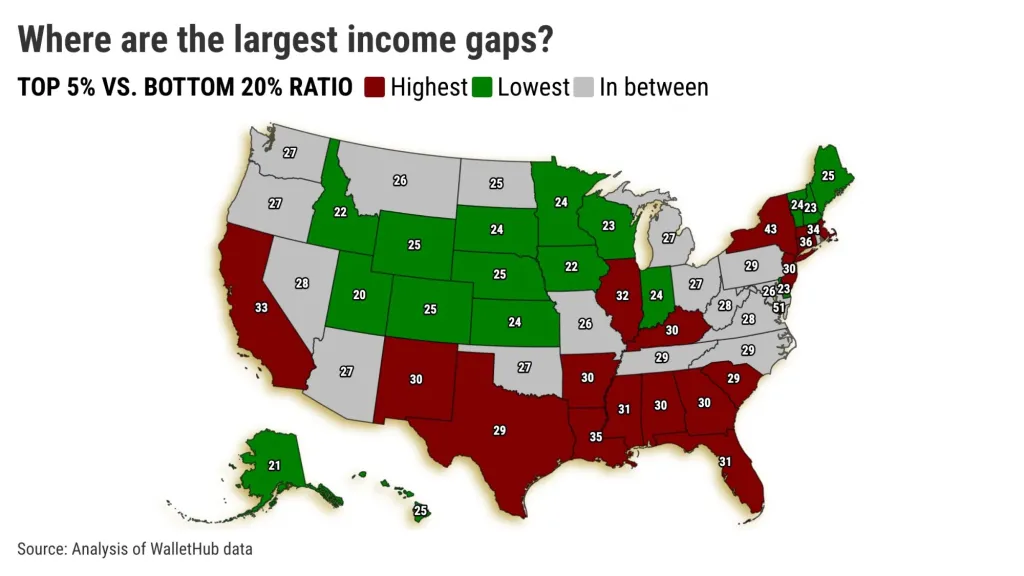
California has a scary wide gap between its top earners and those who have meager paydays — a divide that helps explain, among other things, the state’s housing affordability headaches.
Read more What do Orinda brown birds find so attractive in spiderwebs?
My trusty spreadsheet reviewed recently released household income calculations from the Bureau of Labor Statistics for May 2025 for the 50 states. Tracking slices of the pay scale provides a snapshot of the earnings divide.
Two income gaps were ranked. First, there’s the difference between what’s earned at the 75th percentile (incomes at the median of the top half of the pay scale) compared with the 25th percentile (the median of the bottom half). Next, there’s the gap between the 90th percentile (folks who earn more than 90% of the nation) and the 10th percentile (those who earn more than only 10%).
By averaging the state-by-state rankings of these two income slices, California had the fifth-widest gap among the states.
Wider income gaps were found only in Virginia, Maryland, New York and Texas. The slimmest gaps were in South Dakota, Vermont, Maine, Iowa and North Dakota.
Who can afford this?
This isn’t just political chatter about the haves and have-nots.
Plenty of Californians make big bucks — a flock who can better afford the state’s lofty cost of living. And plenty of Golden Staters are just getting by.
Sadly, the wide pay divide makes life extra financially challenging for lower-income residents. Why? Top earners put upward pressure on the prices of everything from housing to numerous consumer goods and services.
Who can afford California housing? Those at the top.
It’s also why so many businesses, including real estate developers, chase high-income customers with “luxury” products.
The downside? People with smaller paychecks often get left out or overlooked.
How’d we get here?
Let’s take a look at how California incomes stack up, starting with the more modest divide: the 75th percentile vs. the 25th.
California’s 75th percentile earned $97,900, the fifth-highest wage among the states and 33% above the nation’s $80,500. Meanwhile, California’s 25th percentile earned $41,600, the seventh-highest among the states and 11% above the nation’s $37,600.
That adds up to a 135% California gap between the income levels, the sixth-largest spread among the states and topping the nation’s 114%.
The widest gaps were in Maryland at 149%, New Jersey at 145%, and New York at 140%. Smallest? South Dakota at 78%, Vermont at 83% and Kentucky at 89%.
Next, contemplate the divide between the 90th percentile and the 10th.
At the high level, Californians earned $159,000 — No. 2 among the states and 24% above the nation’s $128,600. Contrast that to the low rung, where California’s $36,000 income was fourth-highest among the states and 15% above the nation’s $31,200.
This translates to a 343% California chasm between lofty and lowly incomes. Yes, more than four times higher.
And that’s the fourth-widest gap in the nation, with more extreme gaps found only in Texas at 360%, Virginia at 355% and Massachusetts at 349%.
The narrowest gaps were in Maine at 200%, Vermont at 210% and South Dakota at 224%.
Money moves
Do these income gaps actually change where people decide to live?
The states were divided into three groups based on their overall income-gap ranking. The groups were then measured against the Census Bureau’s net migration numbers between 2020 and 2025. That’s how many people moved into a state from elsewhere, minus how many departed.
The states with the widest income gaps had a collective net outflow of 1.3 million during those five years. However, the states with the smallest income gaps had a 278,000 inflow.
It seems income gaps do matter.
Jonathan Lansner is the business columnist for the Southern California News Group. He can be reached at [email protected].
Read more Warriors GM Dunleavy explains how he’s approaching pivotal NBA draft
About the Author